|
100
|
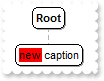
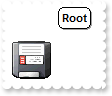
How can I change the background color for parts of the text
with ChartView1 do
begin
	Nodes.Add('Child',Null,Null,Null,Null).Caption := '<bgcolor=FF0000>new</bgcolor> caption';
end
|
|
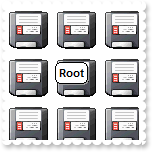
99
|
How can I change the foreground color for parts of the text

with ChartView1 do
begin
	Nodes.Add('Child',Null,Null,Null,Null).Caption := '<fgcolor=FF0000>new</fgcolor> caption';
end
|
|
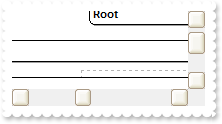
98
|
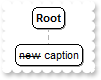
How can I show the node as strikeout
with ChartView1 do
begin
	Nodes.Add('Child',Null,Null,Null,Null).Caption := '<s>new</s> caption';
end
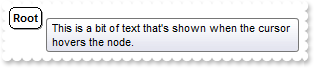
|
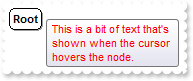
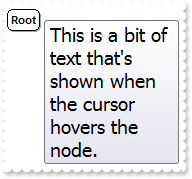
|
97
|
How can I show the node as underlined

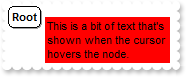
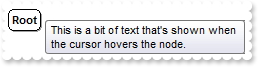
with ChartView1 do
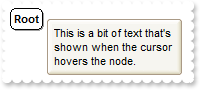
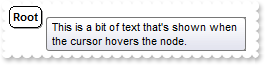
begin
Nodes.Add('Child',Null,Null,Null,Null).Caption := '<u>new</u> caption';
end
|
|
96
|
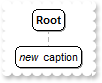
How can I show the node as italic
with ChartView1 do
begin
	Nodes.Add('Child',Null,Null,Null,Null).Caption := '<i>new</i> caption';
end
|
|
95
|
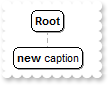
How can I bold the node
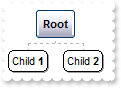
with ChartView1 do
begin
Nodes.Add('Child',Null,Null,Null,Null).Caption := '<b>new</b> caption';
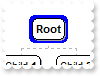
end
|
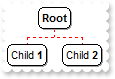
|
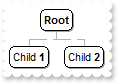
94
|
How can I change the node's caption

with ChartView1 do
begin
	Nodes.Add('Child',Null,Null,Null,Null).Caption := 'new caption';
end
|
|
93
|
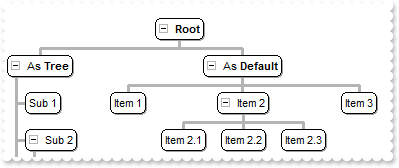
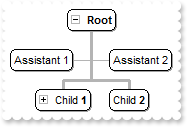
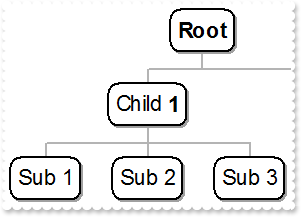
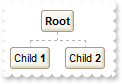
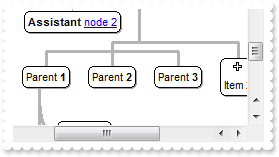
How can I display hierarchical the child nodes so they are indented relative to their parents
with ChartView1 do
begin
HasButtons := EXORGCHARTLib_TLB.exPlus;
PenLink := EXORGCHARTLib_TLB.exPenSolid;
PenWidthLink := 3;
IndentSiblingX := 12;
IndentSiblingY := 12;
Root.Image := 0;
with Nodes do
begin
Add('As <b>Tree</b>',Null,'1234',Null,Null).ArrangeSiblingNodesAs := EXORGCHARTLib_TLB.exTree;
Add('Sub 1','1234',Null,Null,Null);
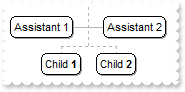
Add('Sub 2','1234','456',Null,Null);
Add('Item 1','456',Null,Null,Null);
Add('Item 2','456','78',Null,Null).Expanded := False;
Add('Item 2.1','78',Null,Null,Null);
Add('Item 2.2','78',Null,Null,Null);
Add('Item 3','456',Null,Null,Null);
Add('Sub 3','1234',Null,Null,Null);
Add('As <b>Default</b>',Null,'AA',Null,Null);
Add('Item 1','AA',Null,Null,Null);
Add('Item 2','AA','BB',Null,Null);
Add('Item 2.1','BB',Null,Null,Null);
Add('Item 2.2','BB',Null,Null,Null);
Add('Item 2.3','BB',Null,Null,Null);
Add('Item 3','AA',Null,Null,Null);
end;
end
|
|
92
|
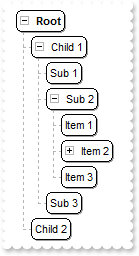
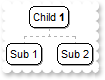
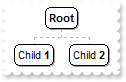
How can I display the child nodes as a tree, so they are indented relative to their parents
with ChartView1 do
begin
	IndentSiblingY := 4;
	HasButtons := EXORGCHARTLib_TLB.exPlus;
	with Root do
	begin
		Image := 0;
		ArrangeSiblingNodesAs := EXORGCHARTLib_TLB.exTree;
	end;
	with Nodes do
	begin
		Add('Child 1',Null,'1234',Null,Null);
		Add('Sub 1','1234',Null,Null,Null);
		Add('Sub 2','1234','456',Null,Null);
		Add('Item 1','456',Null,Null,Null);
		Add('Item 2','456','78',Null,Null).Expanded := False;
		Add('Item 2.1','78',Null,Null,Null);
		Add('Item 2.2','78',Null,Null,Null);
		Add('Item 3','456',Null,Null,Null);
		Add('Sub 3','1234',Null,Null,Null);
		Add('Child 2',Null,Null,Null,Null);
	end;
end
|
|
91
|
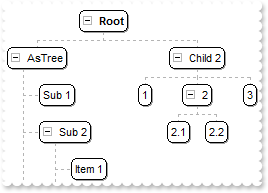
How can I indent the child nodes relative to their parents
with ChartView1 do
begin
	IndentChild := 32;
	HasButtons := EXORGCHARTLib_TLB.exPlus;
	Root.Image := 0;
	with Nodes do
	begin
		Add('AsTree',Null,'1234',Null,Null).ArrangeSiblingNodesAs := EXORGCHARTLib_TLB.exTree;
		Add('Sub 1','1234',Null,Null,Null);
		Add('Sub 2','1234','456',Null,Null);
		Add('Item 1','456',Null,Null,Null);
		Add('Item 2','456','78',Null,Null).Expanded := False;
		Add('Item 2.1','78',Null,Null,Null);
		Add('Item 2.2','78',Null,Null,Null);
		Add('Item 3','456',Null,Null,Null);
		Add('Sub 3','1234',Null,Null,Null);
		Add('Child 2',Null,'AA',Null,Null);
		Add(1,'AA',Null,Null,Null);
		Add(2,'AA','BB',Null,Null);
		Add('2.1','BB',Null,Null,Null);
		Add('2.2','BB',Null,Null,Null);
		Add(3,'AA',Null,Null,Null);
	end;
end
|
|
90
|
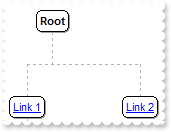
How can I increase the distance between nodes
with ChartView1 do
begin
	IndentSiblingY := 64;
	Root.Image := 0;
	with Nodes do
	begin
		Add('<a1>Link 1</a>',Null,'1234',Null,Null);
		Add('Sub <a1>Link 1</a>','1234',Null,Null,Null);
		Add('Sub 2','1234',Null,Null,Null);
		Add('Sub 3','1234',Null,Null,Null);
		Add('<a2>Link 2</a>',Null,Null,Null,Null);
	end;
end
|
|
89
|
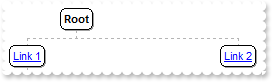
How can I increase the distance between nodes
with ChartView1 do
begin
	IndentSiblingX := 64;
	Root.Image := 0;
	with Nodes do
	begin
		Add('<a1>Link 1</a>',Null,'1234',Null,Null);
		Add('Sub <a1>Link 1</a>','1234',Null,Null,Null);
		Add('Sub 2','1234',Null,Null,Null);
		Add('Sub 3','1234',Null,Null,Null);
		Add('<a2>Link 2</a>',Null,Null,Null,Null);
	end;
end
|
|
88
|
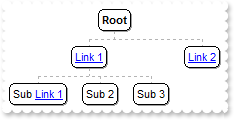
How can I add an anchor or a hyperlink
with ChartView1 do
begin
	Root.Image := 0;
	with Nodes do
	begin
		Add('<a1>Link 1</a>',Null,'1234',Null,Null);
		Add('Sub <a1>Link 1</a>','1234',Null,Null,Null);
		Add('Sub 2','1234',Null,Null,Null);
		Add('Sub 3','1234',Null,Null,Null);
		Add('<a2>Link 2</a>',Null,Null,Null,Null);
	end;
end
|
|
87
|
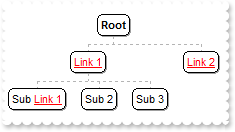
Can I change the visual effect, appearance for the anchor, hyperlink elements, in HTML captions, after the user clicks it
with ChartView1 do
begin
	FormatAnchor[False] := '<u><fgcolor=880000> </fgcolor></u>';
	Root.Image := 0;
	with Nodes do
	begin
		Add('<a1>Link 1</a>',Null,'1234',Null,Null);
		Add('Sub <a1>Link 1</a>','1234',Null,Null,Null);
		Add('Sub 2','1234',Null,Null,Null);
		Add('Sub 3','1234',Null,Null,Null);
		Add('<a2>Link 2</a>',Null,Null,Null,Null);
	end;
end
|
|
86
|
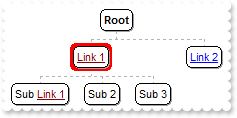
Can I change the visual effect, appearance for the anchor, hyperlink elements, in HTML captions
with ChartView1 do
begin
	FormatAnchor[True] := '<u><fgcolor=FF0000> </fgcolor></u>';
	Root.Image := 0;
	with Nodes do
	begin
		Add('<a1>Link 1</a>',Null,'1234',Null,Null);
		Add('Sub <a1>Link 1</a>','1234',Null,Null,Null);
		Add('Sub 2','1234',Null,Null,Null);
		Add('Sub 3','1234',Null,Null,Null);
		Add('<a2>Link 2</a>',Null,Null,Null,Null);
	end;
end
|
|
83
|
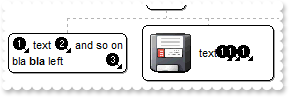
How can I assign multiple icons to a node
with ChartView1 do
begin
	Images('gBJJgBAIDAAGAAEAAQhYAf8Pf4hh0QihCJo2AEZjQAjEZFEaIEaEEaAIAkcbk0olUrlktl0vmExmUzmk1m03nE5nU7nk9n0/oFBoVDolFo1HpFJpVLplNp1PqFRqVTql' +
	'Vq1XrFZrVbrldr1fsFhsVjslls1ntFptVrtltt1vuFxuVzul1u13vF5vV7vl9v1/wGBwWDwmFw2HxGJxWLxmNx0xiFdyOTh8Tf9ZymXx+QytcyNgz8r0OblWjyWds+m0' +
	'ka1Vf1ta1+r1mos2xrG2xeZ0+a0W0qOx3GO4NV3WeyvD2XJ5XL5nN51aiw+lfSj0gkUkAEllHanHI5j/cHg8EZf7w8vl8j4f/qfEZeB09/vjLAB30+kZQAP/P5/H6/yN' +
	'AOAEAwCjMBwFAEDwJBMDwLBYAP2/8Hv8/gAGAD8LQs9w/nhDY/oygIA=');
	HTMLPicture['pic1'] := 'c:\exontrol\images\zipdisk.gif';
	Root.Image := 0;
	with Nodes do
	begin
		Add('Child <b>1</b>',Null,'1234',Null,Null);
		Add('Sub 1','1234',Null,Null,Null).Caption := '<img>1</img> text <img>2</img> and so on<br>bla <b>bla</b> left<r><img>3</img>';
		with Add('Sub 2','1234',Null,Null,Null) do
		begin
			Caption := '<img>pic1</img> text <img>1:6</img><img>1:6</img><img>1</img> <img>2</img>';
			FixedWidth := 124;
			FixedHeight := 48;
		end;
		Add('Sub 3','1234',Null,Null,Null);
		Add('Child <b>2</b>',Null,Null,Null,Null);
	end;
end
|
|
82
|
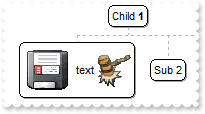
How can I assign multiple pictures to a node
with ChartView1 do
begin
	HTMLPicture['pic1'] := 'c:\exontrol\images\zipdisk.gif';
	HTMLPicture['pic2'] := 'c:\exontrol\images\auction.gif';
	with Root do
	begin
		Image := 0;
		AddAssistant('Assistant 1',Null,Null);
		AddAssistant('Assistant 2',Null,Null);
	end;
	with Nodes do
	begin
		Add('Child <b>1</b>',Null,'1234',Null,Null);
		with Add('Sub 1','1234',Null,Null,Null) do
		begin
			Caption := '<img>pic1</img> text <img>pic2</img>';
			FixedWidth := 108;
			FixedHeight := 48;
		end;
		Add('Sub 2','1234',Null,Null,Null);
		Add('Sub 3','1234',Null,Null,Null);
		Add('Child <b>2</b>',Null,Null,Null,Null);
	end;
end
|
|
81
|
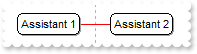
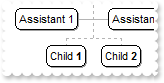
How can I change the color of the line that links assistant nodes
with ChartView1 do
begin
	LinkAssistantColor := RGB(255,0,0);
	with Root do
	begin
		Image := 0;
		AddAssistant('Assistant 1',Null,Null);
		AddAssistant('Assistant 2',Null,Null);
	end;
	with Nodes do
	begin
		Add('Child <b>1</b>',Null,'1234',Null,Null);
		Add('Sub 1','1234',Null,Null,Null);
		Add('Sub 2','1234',Null,Null,Null);
		Add('Sub 3','1234',Null,Null,Null);
		Add('Child <b>2</b>',Null,Null,Null,Null);
	end;
end
|
|
80
|
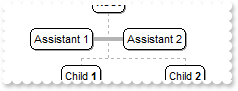
How can I change the width of the line that links assistant nodes
with ChartView1 do
begin
	PenLinkAssistant := EXORGCHARTLib_TLB.exPenSolid;
	PenWidthLinkAssistant := 4;
	with Root do
	begin
		Image := 0;
		AddAssistant('Assistant 1',Null,Null);
		AddAssistant('Assistant 2',Null,Null);
	end;
	with Nodes do
	begin
		Add('Child <b>1</b>',Null,'1234',Null,Null);
		Add('Sub 1','1234',Null,Null,Null);
		Add('Sub 2','1234',Null,Null,Null);
		Add('Sub 3','1234',Null,Null,Null);
		Add('Child <b>2</b>',Null,Null,Null,Null);
	end;
end
|
|
79
|
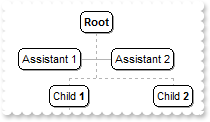
How can I change the style of the line that links assistant nodes
with ChartView1 do
begin
	PenLinkAssistant := EXORGCHARTLib_TLB.exPenDashDotDot;
	with Root do
	begin
		Image := 0;
		AddAssistant('Assistant 1',Null,Null);
		AddAssistant('Assistant 2',Null,Null);
	end;
	with Nodes do
	begin
		Add('Child <b>1</b>',Null,'1234',Null,Null);
		Add('Sub 1','1234',Null,Null,Null);
		Add('Sub 2','1234',Null,Null,Null);
		Add('Sub 3','1234',Null,Null,Null);
		Add('Child <b>2</b>',Null,Null,Null,Null);
	end;
end
|
|
78
|
How can I change the shape of the cursor when it hovers the +/- or expand/collapse buttons
with ChartView1 do
begin
	Cursor[EXORGCHARTLib_TLB.exExpandButtonArea] := 'exHelp';
	HasButtons := EXORGCHARTLib_TLB.exPlus;
	with Root do
	begin
		Image := 0;
		AddAssistant('Assistant 1',Null,Null);
		AddAssistant('Assistant 2',Null,Null);
	end;
	with Nodes do
	begin
		Add('Child <b>1</b>',Null,'1234',Null,Null).Expanded := False;
		Add('Sub 1','1234',Null,Null,Null);
		Add('Sub 2','1234',Null,Null,Null);
		Add('Sub 3','1234',Null,Null,Null);
		Add('Child <b>2</b>',Null,Null,Null,Null);
	end;
end
|
|
77
|
How do I change the shape of the cursor when the user clicks an drags the chart
with ChartView1 do
begin
	Cursor[EXORGCHARTLib_TLB.exDragChart] := 'exHelp';
	with Root do
	begin
		Image := 0;
		AddAssistant('Assistant 1',Null,Null);
		AddAssistant('Assistant 2',Null,Null);
	end;
	with Nodes do
	begin
		Add('Child <b>1</b>',Null,'1234',Null,Null).Expanded := False;
		Add('Sub 1','1234',Null,Null,Null);
		Add('Sub 2','1234',Null,Null,Null);
		Add('Sub 3','1234',Null,Null,Null);
		Add('Child <b>2</b>',Null,Null,Null,Null);
	end;
end
|
|
76
|
How do I change the shape of the cursor when it hovers a node
with ChartView1 do
begin
	Cursor[EXORGCHARTLib_TLB.exNodeArea] := 'exHelp';
	with Root do
	begin
		Image := 0;
		AddAssistant('Assistant 1',Null,Null);
		AddAssistant('Assistant 2',Null,Null);
	end;
	with Nodes do
	begin
		Add('Child <b>1</b>',Null,'1234',Null,Null).Expanded := False;
		Add('Sub 1','1234',Null,Null,Null);
		Add('Sub 2','1234',Null,Null,Null);
		Add('Sub 3','1234',Null,Null,Null);
		Add('Child <b>2</b>',Null,Null,Null,Null);
	end;
end
|
|
75
|
How do I change the shape of the cursor when it hovers the chart
with ChartView1 do
begin
	Cursor[EXORGCHARTLib_TLB.exChartArea] := 'exHelp';
	with Root do
	begin
		Image := 0;
		AddAssistant('Assistant 1',Null,Null);
		AddAssistant('Assistant 2',Null,Null);
	end;
	with Nodes do
	begin
		Add('Child <b>1</b>',Null,'1234',Null,Null).Expanded := False;
		Add('Sub 1','1234',Null,Null,Null);
		Add('Sub 2','1234',Null,Null,Null);
		Add('Sub 3','1234',Null,Null,Null);
		Add('Child <b>2</b>',Null,Null,Null,Null);
	end;
end
|
|
74
|
How can I copy and paste the control's content to Microsoft Word for instance
with ChartView1 do
begin
	HasButtons := EXORGCHARTLib_TLB.exPlus;
	PenLink := EXORGCHARTLib_TLB.exPenSolid;
	PenWidthLink := 3;
	with Root do
	begin
		Image := 0;
		AddAssistant('Assistant 1',Null,Null);
		AddAssistant('Assistant 2',Null,Null);
	end;
	with Nodes do
	begin
		Add('Child <b>1</b>',Null,'1234',Null,Null).Expanded := False;
		Add('Sub 1','1234',Null,Null,Null);
		Add('Sub 2','1234',Null,Null,Null);
		Add('Sub 3','1234',Null,Null,Null);
		Add('Child <b>2</b>',Null,Null,Null,Null);
	end;
end
|
|
73
|
How can I copy and paste the control's content to Microsoft Word for instance
with ChartView1 do
begin
	HasButtons := EXORGCHARTLib_TLB.exPlus;
	ButtonsAlign := EXORGCHARTLib_TLB.MiddleRight;
	with Root do
	begin
		Image := 0;
		AddAssistant('Assistant 1',Null,Null);
		AddAssistant('Assistant 2',Null,Null);
	end;
	with Nodes do
	begin
		Add('Child <b>1</b>',Null,'1234',Null,Null).Expanded := False;
		Add('Sub 1','1234',Null,Null,Null);
		Add('Sub 2','1234',Null,Null,Null);
		Add('Sub 3','1234',Null,Null,Null);
		Add('Child <b>2</b>',Null,Null,Null,Null);
	end;
end
|
|
72
|
How can I enable or disable expanding or collapsing a node when user double clicks it
with ChartView1 do
begin
	ExpandOnDblClk := False;
	HasButtons := EXORGCHARTLib_TLB.exPlus;
	ButtonsAlign := EXORGCHARTLib_TLB.MiddleRight;
	with Root do
	begin
		Image := 0;
		AddAssistant('Assistant 1',Null,Null);
		AddAssistant('Assistant 2',Null,Null);
	end;
	with Nodes do
	begin
		Add('Child <b>1</b>',Null,'1234',Null,Null).Expanded := False;
		Add('Sub 1','1234',Null,Null,Null);
		Add('Sub 2','1234',Null,Null,Null);
		Add('Sub 3','1234',Null,Null,Null);
		Add('Child <b>2</b>',Null,Null,Null,Null);
	end;
end
|
|
71
|
How can I align the +/- expand or collapse buttons to the right

with ChartView1 do
begin
	HasButtons := EXORGCHARTLib_TLB.exPlus;
	ButtonsAlign := EXORGCHARTLib_TLB.MiddleRight;
	with Root do
	begin
		Image := 0;
		AddAssistant('Assistant 1',Null,Null);
		AddAssistant('Assistant 2',Null,Null);
	end;
	with Nodes do
	begin
		Add('Child <b>1</b>',Null,'1234',Null,Null).Expanded := False;
		Add('Sub 1','1234',Null,Null,Null);
		Add('Sub 2','1234',Null,Null,Null);
		Add('Sub 3','1234',Null,Null,Null);
		Add('Child <b>2</b>',Null,Null,Null,Null);
	end;
end
|
|
70
|
Can I display the +/- expand or collapse buttons using your EBN files
with ChartView1 do
begin
	with VisualAppearance do
	begin
		Add(11,'c:\exontrol\images\normal.ebn');
		Add(22,'c:\exontrol\images\pushed.ebn');
		Add(1,'CP:11 2 2 -2 -2');
		Add(2,'CP:22 2 2 -2 -2');
	end;
	HasButtons := EXORGCHARTLib_TLB.exCustom;
	HasButtonsCustom[True] := 33554432;
	HasButtonsCustom[False] := 16777216;
	with Root do
	begin
		Image := 0;
		AddAssistant('Assistant 1',Null,Null);
		AddAssistant('Assistant 2',Null,Null);
	end;
	with Nodes do
	begin
		Add('Child <b>1</b>',Null,'1234',Null,Null).Expanded := False;
		Add('Sub 1','1234',Null,Null,Null);
		Add('Sub 2','1234',Null,Null,Null);
		Add('Sub 3','1234',Null,Null,Null);
		Add('Child <b>2</b>',Null,Null,Null,Null);
	end;
end
|
|
69
|
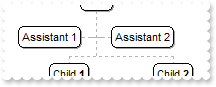
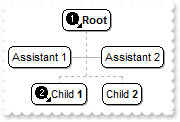
How can I change the +/- expand or collapse buttons
with ChartView1 do
begin
	Images('gBJJgBAIDAAGAAEAAQhYAf8Pf4hh0QihCJo2AEZjQAjEZFEaIEaEEaAIAkcbk0olUrlktl0vmExmUzmk1m03nE5nU7nk9n0/oFBoVDolFo1HpFJpVLplNp1PqFRqVTql' +
	'Vq1XrFZrVbrldr1fsFhsVjslls1ntFptVrtltt1vuFxuVzul1u13vF5vV7vl9v1/wGBwWDwmFw2HxGJxWLxmNx0xiFdyOTh8Tf9ZymXx+QytcyNgz8r0OblWjyWds+m0' +
	'ka1Vf1ta1+r1mos2xrG2xeZ0+a0W0qOx3GO4NV3WeyvD2XJ5XL5nN51aiw+lfSj0gkUkAEllHanHI5j/cHg8EZf7w8vl8j4f/qfEZeB09/vjLAB30+kZQAP/P5/H6/yN' +
	'AOAEAwCjMBwFAEDwJBMDwLBYAP2/8Hv8/gAGAD8LQs9w/nhDY/oygIA=');
	HasButtons := EXORGCHARTLib_TLB.exCustom;
	HasButtonsCustom[True] := 1;
	HasButtonsCustom[False] := 2;
	with Root do
	begin
		Image := 0;
		AddAssistant('Assistant 1',Null,Null);
		AddAssistant('Assistant 2',Null,Null);
	end;
	with Nodes do
	begin
		Add('Child <b>1</b>',Null,'1234',Null,Null).Expanded := False;
		Add('Sub 1','1234',Null,Null,Null);
		Add('Sub 2','1234',Null,Null,Null);
		Add('Sub 3','1234',Null,Null,Null);
		Add('Child <b>2</b>',Null,Null,Null,Null);
	end;
end
|
|
68
|
How can I change the +/- expand or collapse buttons
with ChartView1 do
begin
	HasButtons := EXORGCHARTLib_TLB.exCircle;
	with Root do
	begin
		Image := 0;
		AddAssistant('Assistant 1',Null,Null);
		AddAssistant('Assistant 2',Null,Null);
	end;
	with Nodes do
	begin
		Add('Child <b>1</b>',Null,'1234',Null,Null).Expanded := False;
		Add('Sub 1','1234',Null,Null,Null);
		Add('Sub 2','1234',Null,Null,Null);
		Add('Sub 3','1234',Null,Null,Null);
		Add('Child <b>2</b>',Null,Null,Null,Null);
	end;
end
|
|
67
|
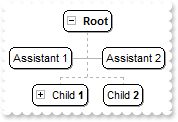
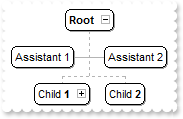
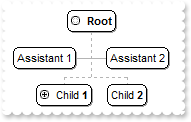
How can I display +/- expand or collapse buttons

with ChartView1 do
begin
	HasButtons := EXORGCHARTLib_TLB.exPlus;
	with Root do
	begin
		Image := 0;
		AddAssistant('Assistant 1',Null,Null);
		AddAssistant('Assistant 2',Null,Null);
	end;
	with Nodes do
	begin
		Add('Child <b>1</b>',Null,'1234',Null,Null).Expanded := False;
		Add('Sub 1','1234',Null,Null,Null);
		Add('Sub 2','1234',Null,Null,Null);
		Add('Sub 3','1234',Null,Null,Null);
		Add('Child <b>2</b>',Null,Null,Null,Null);
	end;
end
|
|
66
|
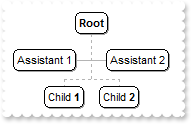
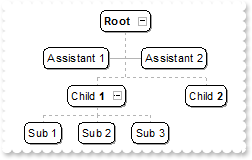
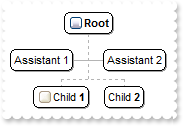
How do I show or hide the assistant nodes
with ChartView1 do
begin
	ShowAssistants := True;
	with Root do
	begin
		Image := 0;
		AddAssistant('Assistant 1',Null,Null);
		AddAssistant('Assistant 2',Null,Null);
	end;
	with Nodes do
	begin
		Add('Child <b>1</b>',Null,'1234',Null,Null);
		Add('Sub 1','1234',Null,Null,Null);
		Add('Sub 2','1234',Null,Null,Null);
		Add('Sub 3','1234',Null,Null,Null);
		Add('Child <b>2</b>',Null,Null,Null,Null);
	end;
end
|
|
65
|
How do I scale or zoom the chart
with ChartView1 do
begin
	BorderWidth := 18;
	BorderHeight := 18;
	ZoomWidthMode := EXORGCHARTLib_TLB.exCustomSize;
	ZoomHeightMode := EXORGCHARTLib_TLB.exCustomSize;
	ZoomWidth := 2;
	ZoomHeight := 2;
	Root.Image := 0;
	with Nodes do
	begin
		Add('Child <b>1</b>',Null,'1234',Null,Null);
		Add('Sub 1','1234',Null,Null,Null);
		Add('Sub 2','1234',Null,Null,Null);
		Add('Sub 3','1234',Null,Null,Null);
		Add('Child <b>2</b>',Null,Null,Null,Null);
	end;
end
|
|
64
|
How do I scale or zoom the chart
with ChartView1 do
begin
	BorderWidth := 18;
	BorderHeight := 18;
	ZoomWidthMode := EXORGCHARTLib_TLB.exControlSize;
	ZoomHeightMode := EXORGCHARTLib_TLB.exControlSize;
	Root.Image := 0;
	with Nodes do
	begin
		Add('Child <b>1</b>',Null,'1234',Null,Null);
		Add('Sub 1','1234',Null,Null,Null);
		Add('Sub 2','1234',Null,Null,Null);
		Add('Sub 3','1234',Null,Null,Null);
		Add('Child <b>2</b>',Null,Null,Null,Null);
	end;
end
|
|
63
|
How can I ensure that the selected node is visible or fits the chart's area
with ChartView1 do
begin
	EnsureVisibleOnSelect := True;
	ScrollOnEnsure := False;
	BorderWidth := 18;
	BorderHeight := 18;
	ZoomWidthMode := EXORGCHARTLib_TLB.exCustomSize;
	ZoomHeightMode := EXORGCHARTLib_TLB.exCustomSize;
	ZoomWidth := 2;
	ZoomHeight := 2;
	Root.Image := 0;
	with Nodes do
	begin
		Add('Child <b>1</b>',Null,'1234',Null,Null);
		Add('Sub 1','1234',Null,Null,Null);
		Add('Sub 2','1234',Null,Null,Null);
		Add('Sub 3','1234',Null,Null,Null);
		Add('Child <b>2</b>',Null,Null,Null,Null);
	end;
end
|
|
62
|
How do I avoid slow moving the chart when the user selects a new node

with ChartView1 do
begin
	ScrollByClick := False;
end
|
|
61
|
How do I ensure that a node is visible or fits the chart's area
with ChartView1 do
begin
	Root.Image := 0;
	with Nodes do
	begin
		Add('Child <b>1</b>',Null,'1234',Null,Null);
		Add('Sub 1','1234',Null,Null,Null);
		Add('Sub 2','1234',Null,Null,Null);
		Add('Child <b>2</b>',Null,Null,Null,Null);
	end;
	EnsureVisibleNode('1234');
end
|
|
60
|
How do I change the root node, so it explore from a specified node
with ChartView1 do
begin
	Root.Image := 0;
	with Nodes do
	begin
		Add('Child <b>1</b>',Null,'1234',Null,Null);
		Add('Sub 1','1234',Null,Null,Null);
		Add('Sub 2','1234',Null,Null,Null);
		Add('Child <b>2</b>',Null,Null,Null,Null);
	end;
	ExploreFromNode := '1234';
end
|
|
59
|
How do I select a node
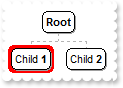
with ChartView1 do
begin
	Root.Image := 0;
	with Nodes do
	begin
		Add('Child <b>1</b>',Null,'1234',Null,Null);
		Add('Child <b>2</b>',Null,Null,Null,Null);
	end;
	SelectNode := '1234';
	HideSelection := False;
end
|
|
57
|
How do I fix the height for all nodes
with ChartView1 do
begin
	FixedHeightNode := 32;
	Root.Image := 0;
	with Nodes do
	begin
		Add('Child <b>1</b>',Null,Null,Null,Null);
		Add('Child <b>2</b>',Null,Null,Null,Null);
	end;
end
|
|
56
|
How do I fix the width for all nodes
with ChartView1 do
begin
	FixedWidthNode := 128;
	Root.Image := 0;
	with Nodes do
	begin
		Add('Child <b>1</b>',Null,Null,Null,Null);
		Add('Child <b>2</b>',Null,Null,Null,Null);
	end;
end
|
|
55
|
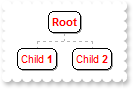
How do I change the style of the link between nodes
with ChartView1 do
begin
	PenLink := EXORGCHARTLib_TLB.exPenDash;
	with Nodes do
	begin
		Add('Child <b>1</b>',Null,Null,Null,Null);
		Add('Child <b>2</b>',Null,Null,Null,Null);
	end;
end
|
|
54
|
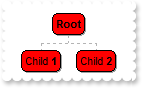
How do I change the color to link the nodes
with ChartView1 do
begin
	LinkColor := RGB(255,0,0);
	with Nodes do
	begin
		Add('Child <b>1</b>',Null,Null,Null,Null);
		Add('Child <b>2</b>',Null,Null,Null,Null);
	end;
end
|
|
53
|
How do I change the shape for selected node, using your EBN files
with ChartView1 do
begin
	VisualAppearance.Add(2,'c:\exontrol\images\pushed.ebn');
	SelColor := $2000000;
	SelectNode := 'root';
	HideSelection := False;
	with Nodes do
	begin
		Add('Child <b>1</b>',Null,Null,Null,Null);
		Add('Child <b>2</b>',Null,Null,Null,Null);
	end;
end
|
|
52
|
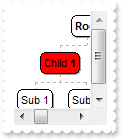
How do I change the color for selected node
with ChartView1 do
begin
	SelColor := RGB(0,0,255);
	SelectNode := 'root';
	HideSelection := False;
	with Nodes do
	begin
		Add('Child <b>1</b>',Null,Null,Null,Null);
		Add('Child <b>2</b>',Null,Null,Null,Null);
	end;
end
|
|
51
|
How do I hide the node's shadow

with ChartView1 do
begin
	ShadowNode := False;
end
|
|
50
|
How do I change the pen to draw the border for all nodes

with ChartView1 do
begin
	PenBorderNode := EXORGCHARTLib_TLB.exPenDot;
end
|
|
49
|
How do I change the shape of the border for all nodes

with ChartView1 do
begin
	VisualAppearance.Add(2,'c:\exontrol\images\pushed.ebn');
	Background[EXORGCHARTLib_TLB.exNodeFrame] := $2000000;
end
|
|
48
|
How do I change the shape of the border for all nodes

with ChartView1 do
begin
	DrawRoundNode := False;
end
|
|
47
|
How do I change the foreground color for all nodes
with ChartView1 do
begin
	ForeColorNode := RGB(255,0,0);
	with Nodes do
	begin
		Add('Child <b>1</b>',Null,Null,Null,Null);
		Add('Child <b>2</b>',Null,Null,Null,Null);
	end;
end
|
|
46
|
How do I change the background color for all nodes
with ChartView1 do
begin
	BackColorNode := RGB(255,0,0);
	with Nodes do
	begin
		Add('Child <b>1</b>',Null,Null,Null,Null);
		Add('Child <b>2</b>',Null,Null,Null,Null);
	end;
end
|
|
45
|
How do I change the key of the root

with ChartView1 do
begin
	Root.Key := 'myKey';
end
|
|
44
|
How do I change the caption of the root

with ChartView1 do
begin
	Root.Caption := 'new<br>root';
end
|
|
43
|
How do I access the root node

with ChartView1 do
begin
	Root.Caption := 'new<br>root';
end
|
|
42
|
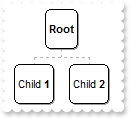
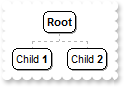
How do I access the nodes collection
with ChartView1 do
begin
	with Nodes do
	begin
		Add('Child <b>1</b>',Null,Null,Null,Null);
		Add('Child <b>2</b>',Null,Null,Null,Null);
	end;
end
|
|
41
|
How do I refresh the control
with ChartView1 do
begin
	Nodes.Add('Child <b>1</b>',Null,Null,Null,Null);
	Nodes.Add('Child <b>2</b>',Null,Null,Null,Null);
	Refresh();
end
|
|
40
|
How do I prevent painting while several changes are performed
with ChartView1 do
begin
	BeginUpdate();
	Nodes.Add('Child <b>1</b>',Null,Null,Null,Null);
	Nodes.Add('Child <b>2</b>',Null,Null,Null,Null);
	EndUpdate();
end
|
|
39
|
How do I indent the full chart to the right

with ChartView1 do
begin
	BorderWidth := 8;
	BorderHeight := 8;
end
|
|
38
|
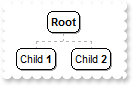
How can I change the node's border/frame, using your EBN files
with ChartView1 do
begin
	VisualAppearance.Add(1,'c:\exontrol\images\normal.ebn');
	Background[EXORGCHARTLib_TLB.exNodeFrame] := $1000000;
	Nodes.Add('Child <b>1</b>',Null,Null,Null,Null);
	Nodes.Add('Child <b>2</b>',Null,Null,Null,Null);
end
|
|
37
|
How can still display the selected node when the control loses the focus

with ChartView1 do
begin
	HideSelection := False;
end
|
|
36
|
How do I disable or enable the control
with ChartView1 do
begin
	Enabled := False;
end
|
|
35
|
How do I change the visual aspect for thumb parts in the scroll bars, using EBN
with ChartView1 do
begin
VisualAppearance.Add(1,'c:\exontrol\images\normal.ebn');
VisualAppearance.Add(2,'c:\exontrol\images\pushed.ebn');
VisualAppearance.Add(3,'c:\exontrol\images\hot.ebn');
Background[EXORGCHARTLib_TLB.exHSThumb] := $1000000;
Background[EXORGCHARTLib_TLB.exHSThumbP] := $2000000;
Background[EXORGCHARTLib_TLB.exHSThumbH] := $3000000;
Background[EXORGCHARTLib_TLB.exVSThumb] := $1000000;
Background[EXORGCHARTLib_TLB.exVSThumbP] := $2000000;
Background[EXORGCHARTLib_TLB.exVSThumbH] := $3000000;
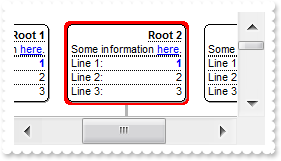
FixedWidthNode := 320;
end
|
|
34
|
How do I change the visual aspect only for the thumb in the scroll bar, using EBN
with ChartView1 do
begin
	VisualAppearance.Add(1,'c:\exontrol\images\normal.ebn');
	VisualAppearance.Add(2,'c:\exontrol\images\pushed.ebn');
	VisualAppearance.Add(3,'c:\exontrol\images\hot.ebn');
	Background[EXORGCHARTLib_TLB.exHSThumb] := $1000000;
	Background[EXORGCHARTLib_TLB.exHSThumbP] := $2000000;
	Background[EXORGCHARTLib_TLB.exHSThumbH] := $3000000;
	ScrollThumbSize[EXORGCHARTLib_TLB.exHScroll] := 96;
	FixedWidthNode := 320;
end
|
|
33
|
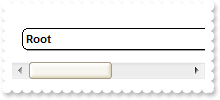
I've seen that you can change the visual appearance for the scroll bar. How can I do that
with ChartView1 do
begin
	VisualAppearance.Add(1,'c:\exontrol\images\normal.ebn');
	VisualAppearance.Add(2,'c:\exontrol\images\pushed.ebn');
	VisualAppearance.Add(3,'c:\exontrol\images\hot.ebn');
	Background[EXORGCHARTLib_TLB.exSBtn] := $1000000;
	Background[EXORGCHARTLib_TLB.exSBtnP] := $2000000;
	Background[EXORGCHARTLib_TLB.exSBtnH] := $3000000;
	Background[EXORGCHARTLib_TLB.exHSBack] := $f0f0f0;
	Background[EXORGCHARTLib_TLB.exVSBack] := $f0f0f0;
	Background[EXORGCHARTLib_TLB.exSizeGrip] := $f0f0f0;
	FixedWidthNode := 320;
end
|
|
32
|
Can I change the forecolor for the tooltip
with ChartView1 do
begin
	ToolTipDelay := 1;
	ToolTipWidth := 364;
	Background[EXORGCHARTLib_TLB.exToolTipForeColor] := $ff;
	Root.ToolTip := 'This is a bit of text that''s shown when the cursor hovers the node.';
end
|
|
31
|
Can I change the background color for the tooltip
with ChartView1 do
begin
	ToolTipDelay := 1;
	ToolTipWidth := 364;
	Background[EXORGCHARTLib_TLB.exToolTipBackColor] := $ff;
	Root.ToolTip := 'This is a bit of text that''s shown when the cursor hovers the node.';
end
|
|
30
|
Can I change the default border of the tooltip, using your EBN files
with ChartView1 do
begin
	ToolTipDelay := 1;
	ToolTipWidth := 364;
	VisualAppearance.Add(1,'c:\exontrol\images\normal.ebn');
	Background[EXORGCHARTLib_TLB.exToolTipAppearance] := $1000000;
	Root.ToolTip := 'This is a bit of text that''s shown when the cursor hovers the node.';
end
|
|
29
|
How do I call your x-script language

with ChartView1 do
begin
	ExecuteTemplate('BackColor = RGB(255,0,0)');
end
|
|
28
|
How do I call your x-script language

with ChartView1 do
begin
	Template := 'BackColor = RGB(255,0,0)';
end
|
|
27
|
Can I change the font for the tooltip
with ChartView1 do
begin
	ToolTipDelay := 1;
	with ToolTipFont do
	begin
		Name := 'Tahoma';
		Size := 14;
	end;
	ToolTipWidth := 364;
	Root.ToolTip := 'This is a bit of text that''s shown when the cursor hovers the node.';
end
|
|
26
|
I've seen that the width of the tooltip is variable. Can I make it larger
with ChartView1 do
begin
	ToolTipWidth := 328;
	Root.ToolTip := 'This is a bit of text that''s shown when the cursor hovers the node.';
end
|
|
25
|
How do I let the tooltip being displayed longer
with ChartView1 do
begin
	ToolTipPopDelay := 10000;
	Root.ToolTip := 'This is a bit of text that''s shown when the cursor hovers the node.';
end
|
|
24
|
How do I disable showing the tooltip for all control
with ChartView1 do
begin
	ToolTipDelay := 0;
	Root.ToolTip := 'This is a bit of text that''s shown when the cursor hovers the node.';
end
|
|
23
|
How do I show the tooltip quicker
with ChartView1 do
begin
	ToolTipDelay := 1;
	Root.ToolTip := 'This is a bit of text that''s shown when the cursor hovers the node.';
end
|
|
22
|
Can I change the order of the buttons in the scroll bar
with ChartView1 do
begin
	ScrollOrderParts[EXORGCHARTLib_TLB.exHScroll] := 't,l,r';
	ScrollOrderParts[EXORGCHARTLib_TLB.exVScroll] := 't,l,r';
	FixedWidthNode := 320;
end
|
|
21
|
The thumb size seems to be very small. Can I make it bigger

with ChartView1 do
begin
	ScrollThumbSize[EXORGCHARTLib_TLB.exHScroll] := 164;
	FixedWidthNode := 320;
end
|
|
20
|
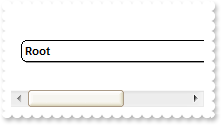
How do I enlarge or change the size of the control's scrollbars
with ChartView1 do
begin
	ScrollHeight := 18;
	ScrollWidth := 18;
	ScrollButtonWidth := 18;
	ScrollButtonHeight := 18;
	FixedWidthNode := 320;
	FixedHeightNode := 320;
end
|
|
19
|
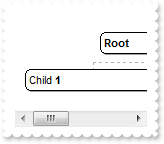
How can I display my text on the scroll bar, using a different font

with ChartView1 do
begin
	ScrollPartCaption[EXORGCHARTLib_TLB.exHScroll,EXORGCHARTLib_TLB.exThumbPart] := 'This is just a text';
	ScrollFont[EXORGCHARTLib_TLB.exHScroll].Size := 12;
	ScrollThumbSize[EXORGCHARTLib_TLB.exHScroll] := 128;
	ScrollHeight := 24;
	ScrollPartCaption[EXORGCHARTLib_TLB.exHScroll,EXORGCHARTLib_TLB.exThumbPart] := 'This is <s><font Tahoma;12> just </font></s> text';
	ScrollHeight := 20;
	FixedWidthNode := 320;
end
|
|
18
|
How can I display my text on the scroll bar

with ChartView1 do
begin
	ScrollPartCaption[EXORGCHARTLib_TLB.exHScroll,EXORGCHARTLib_TLB.exThumbPart] := 'this is just a text';
	ScrollThumbSize[EXORGCHARTLib_TLB.exHScroll] := 96;
	FixedWidthNode := 320;
end
|
|
17
|
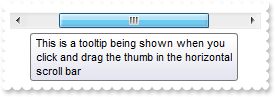
How do I assign a tooltip to a scrollbar
with ChartView1 do
begin
	ScrollToolTip[EXORGCHARTLib_TLB.exHScroll] := 'This is a tooltip being shown when you click and drag the thumb in the horizontal scroll bar';
	FixedWidthNode := 320;
end
|
|
16
|
How do I assign an icon to the button in the scrollbar

with ChartView1 do
begin
	Images('gBJJgBAIDAAGAAEAAQhYAf8Pf4hh0QihCJo2AEZjQAjEZFEaIEaEEaAIAkcbk0olUrlktl0vmExmUzmk1m03nE5nU7nk9n0/oFBoVDolFo1HpFJpVLplNp1PqFRqVTql' +
	'Vq1XrFZrVbrldr1fsFhsVjslls1ntFptVrtltt1vuFxuVzul1u13vF5vV7vl9v1/wGBwWDwmFw2HxGJxWLxmNx0xiFdyOTh8Tf9ZymXx+QytcyNgz8r0OblWjyWds+m0' +
	'ka1Vf1ta1+r1mos2xrG2xeZ0+a0W0qOx3GO4NV3WeyvD2XJ5XL5nN51aiw+lfSj0gkUkAEllHanHI5j/cHg8EZf7w8vl8j4f/qfEZeB09/vjLAB30+kZQAP/P5/H6/yN' +
	'AOAEAwCjMBwFAEDwJBMDwLBYAP2/8Hv8/gAGAD8LQs9w/nhDY/oygIA=');
	ScrollPartVisible[EXORGCHARTLib_TLB.exHScroll,EXORGCHARTLib_TLB.exLeftB1Part] := True;
	ScrollPartCaption[EXORGCHARTLib_TLB.exHScroll,EXORGCHARTLib_TLB.exLeftB1Part] := '<img>1</img>';
	ScrollHeight := 18;
	ScrollButtonWidth := 18;
	FixedWidthNode := 320;
end
|
|
15
|
I need to add a button in the scroll bar. Is this possible

with ChartView1 do
begin
	ScrollPartVisible[EXORGCHARTLib_TLB.exHScroll,EXORGCHARTLib_TLB.exLeftB1Part] := True;
	ScrollPartCaption[EXORGCHARTLib_TLB.exHScroll,EXORGCHARTLib_TLB.exLeftB1Part] := '1';
	FixedWidthNode := 320;
end
|
|
14
|
Can I display an additional buttons in the scroll bar

with ChartView1 do
begin
	ScrollPartVisible[EXORGCHARTLib_TLB.exHScroll,EXORGCHARTLib_TLB.exLeftB1Part] := True;
	ScrollPartVisible[EXORGCHARTLib_TLB.exHScroll,EXORGCHARTLib_TLB.exLeftB2Part] := True;
	ScrollPartVisible[EXORGCHARTLib_TLB.exHScroll,EXORGCHARTLib_TLB.exRightB6Part] := True;
	ScrollPartVisible[EXORGCHARTLib_TLB.exHScroll,EXORGCHARTLib_TLB.exRightB5Part] := True;
	FixedWidthNode := 320;
end
|
|
13
|
How do I change the control's foreground color

with ChartView1 do
begin
	ForeColor := RGB(255,0,0);
end
|
|
12
|
How do I change the control's background color

with ChartView1 do
begin
	BackColor := RGB(200,200,200);
end
|
|
11
|
How can I change the control's font

with ChartView1 do
begin
	Font.Name := 'Verdana';
	Refresh();
end
|
|
10
|
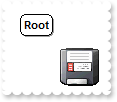
How do I put a picture on the center of the control

with ChartView1 do
begin
	Picture := ChartView1.ExecuteTemplate('loadpicture(`c:\exontrol\images\zipdisk.gif`)');
	PictureDisplay := EXORGCHARTLib_TLB.MiddleCenter;
end
|
|
9
|
How do I resize/stretch a picture on the control's background

with ChartView1 do
begin
	Picture := ChartView1.ExecuteTemplate('loadpicture(`c:\exontrol\images\zipdisk.gif`)');
	PictureDisplay := EXORGCHARTLib_TLB.Stretch;
end
|
|
8
|
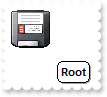
How do I put a picture on the control's center right bottom side
with ChartView1 do
begin
	Picture := ChartView1.ExecuteTemplate('loadpicture(`c:\exontrol\images\zipdisk.gif`)');
	PictureDisplay := EXORGCHARTLib_TLB.LowerRight;
end
|
|
7
|
How do I put a picture on the control's center left bottom side
with ChartView1 do
begin
	Picture := ChartView1.ExecuteTemplate('loadpicture(`c:\exontrol\images\zipdisk.gif`)');
	PictureDisplay := EXORGCHARTLib_TLB.LowerLeft;
end
|
|
6
|
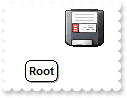
How do I put a picture on the control's center top side
with ChartView1 do
begin
	Picture := ChartView1.ExecuteTemplate('loadpicture(`c:\exontrol\images\zipdisk.gif`)');
	PictureDisplay := EXORGCHARTLib_TLB.UpperCenter;
end
|
|
5
|
How do I put a picture on the control's right top corner
with ChartView1 do
begin
	Picture := ChartView1.ExecuteTemplate('loadpicture(`c:\exontrol\images\zipdisk.gif`)');
	PictureDisplay := EXORGCHARTLib_TLB.UpperRight;
end
|
|
4
|
How do I put a picture on the control's left top corner
with ChartView1 do
begin
	Picture := ChartView1.ExecuteTemplate('loadpicture(`c:\exontrol\images\zipdisk.gif`)');
	PictureDisplay := EXORGCHARTLib_TLB.UpperLeft;
end
|
|
3
|
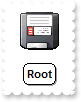
How do I put a picture on the control's background
with ChartView1 do
begin
	Picture := ChartView1.ExecuteTemplate('loadpicture(`c:\exontrol\images\zipdisk.gif`)');
end
|
|
2
|
How do I change the control's border, using your EBN files
with ChartView1 do
begin
	VisualAppearance.Add(1,'c:\exontrol\images\normal.ebn');
	Appearance := EXORGCHARTLib_TLB.AppearanceEnum($1000000);
end
|
|
1
|
How do I remove the control's border
with ChartView1 do
begin
	Appearance := EXORGCHARTLib_TLB.None2;
end
|